Follow us


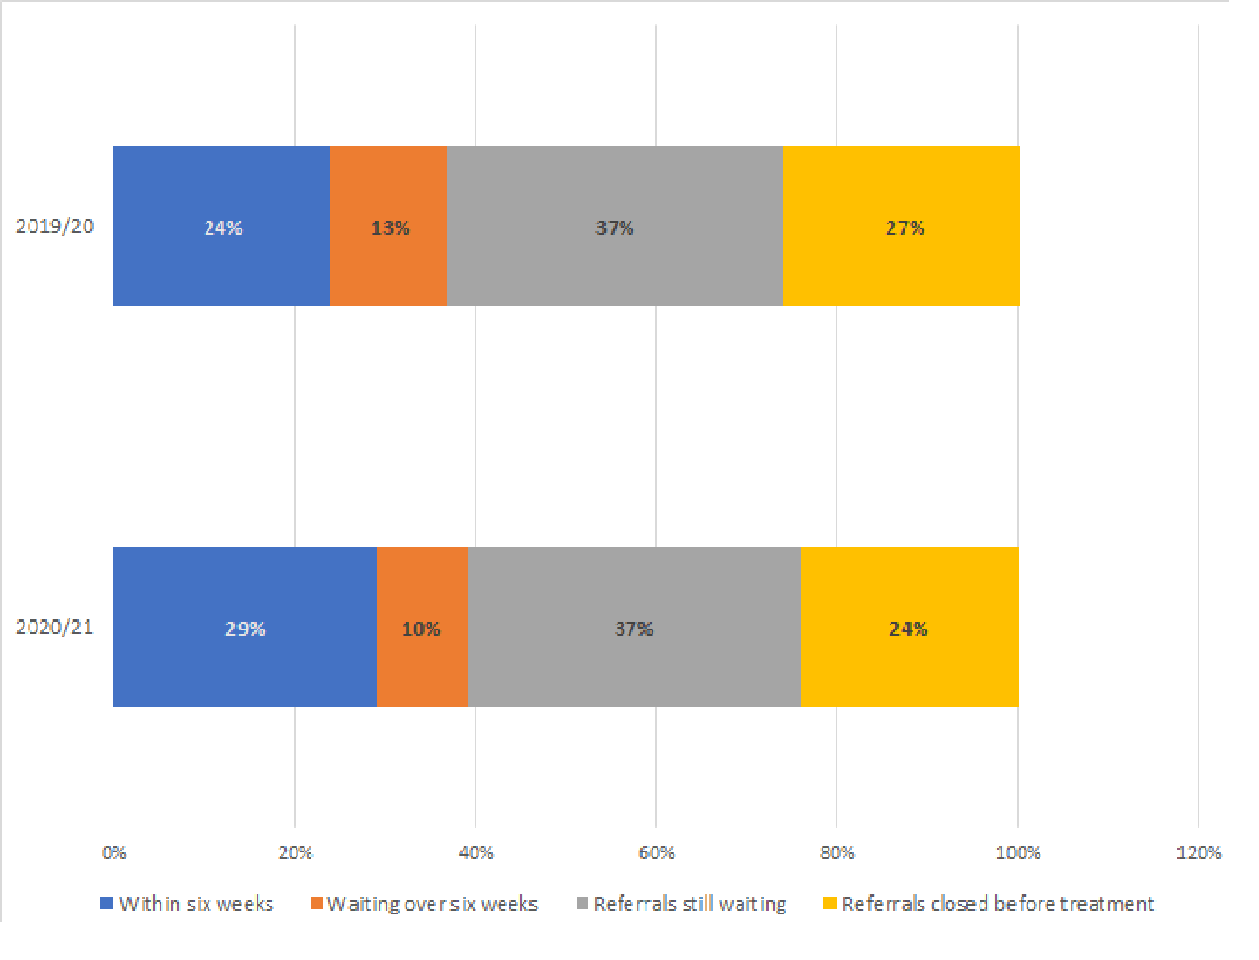
Of the 497,502 children referred to CYPMHS in 2020/21, two-fifths received two contacts within the year (our proxy for entering treatment).
Figure 1. Percentage of children referred to CYPMHS in 2018/19 to 2020/21 by outcome.
Amongst those who do receive two contacts within the year, national average waiting times for children referred to CYPMHS have reduced for three consecutive years. The average waiting time from referral to second contact has improved from 53 days in 2018/19 and 43 days in 2019/20 to 32 days in 2020/21.
This year, 29 CCGs (21%) had an average waiting time of three weeks (21 days) or less – a considerable increase from 11 CCGs in 2019/20 and three CCGs in 2018/19. Furthermore, 85% (115) of CCGs improved their average waiting times in 2020/21, the same as last year.
On average, CCGs with the largest decreases in waiting time (for those who received two contacts) also saw the biggest rise in the number of children still waiting without two contacts. This implies that a higher proportion of children are being placed on waiting lists, while those who manage to enter treatment (perhaps due to symptom severity and other vulnerabilities) are getting seen faster.
Table 1. CCGs with the lowest waiting times between referral and second contact with CYPMHS in 2020/21.
| Clinical Commissioning Group (CCG) | Avg. waiting time 2019/20 (days) | Avg. waiting time 2020/21 (days) | Avg. waiting time change (days) |
|---|---|---|---|
| NHS CASTLE POINT AND ROCHFORD CCG | 26 | 6 | -20 |
| NHS BASILDON AND BRENTWOOD CCG | 29 | 7 | -22 |
| NHS EAST LEICESTERSHIRE AND RUTLAND CCG | 38 | 9 | -29 |
| NHS MID ESSEX CCG | 30 | 9 | -21 |
| NHS NORTH EAST ESSEX CCG | 24 | 9 | -15 |
| NHS WEST LEICESTERSHIRE CCG | 44 | 10 | -34 |
| NHS WEST ESSEX CCG | 38 | 10 | -28 |
| NHS SOUTHEND CCG | 36 | 10 | -26 |
| NHS TOWER HAMLETS CCG | 21 | 12 | -9 |
| NHS LEICESTER CITY CCG | 38 | 13 | -25 |
CCGs with the longest waiting times between referral and second contact with CYPMHS in 2020/21.
| Clinical Commissioning Group (CCG) | Avg. waiting time 2019/20 | Avg. waiting time 2020/21 | Avg. waiting time change |
|---|---|---|---|
| NHS CANNOCK CHASE CCG | 57 | 81 | 24 |
| NHS NORTH HAMPSHIRE CCG | 84 | 74 | -10 |
| NHS NORTH EAST HAMPSHIRE AND FARNHAM CCG | 61 | 67 | 6 |
| NHS SOUTH EASTERN HAMPSHIRE CCG | 61 | 65 | 4 |
| NHS STAFFORD AND SURROUNDS CCG | 55 | 64 | 9 |
| NHS FYLDE & WYRE CCG | 87 | 63 | -24 |
| NHS FAREHAM AND GOSPORT CCG | 61 | 63 | 2 |
| NHS BLACKPOOL CCG | 68 | 59 | -9 |
| NHS SOUTH EAST STAFFORDSHIRE AND SEISDON PENINSULA CCG | 53 | 58 | 5 |
| NHS SOUTH TYNESIDE CCG | 75 | 57 | -18 |
Table 2. The 10 CCGs with the largest increases in average waiting time from 2017/18 to 2019/20.
| Clinical Commissioning Group (CCG) | Avg. waiting time 2019/20 (days) | Avg. waiting time 2020/21 (days) | Avg. waiting time change (days) |
|---|---|---|---|
| NHS CANNOCK CHASE CCG | 57 | 81 | 24 |
| NHS ISLE OF WIGHT CCG | 45 | 56 | 11 |
| NHS BARKING AND DAGENHAM CCG | 8 | 18 | 10 |
| NHS STAFFORD AND SURROUNDS CCG | 55 | 64 | 9 |
| NHS TELFORD AND WREKIN CCG | 17 | 26 | 9 |
| NHS ROTHERHAM CCG | 12 | 20 | 8 |
| NHS NORTH EAST HAMPSHIRE AND FARNHAM CCG | 61 | 67 | 6 |
| NHS OLDHAM CCG | 33 | 39 | 6 |
| NHS SOUTH EAST STAFFORDSHIRE AND SEISDON PENINSULA CCG | 53 | 58 | 5 |
| NHS SOUTH EASTERN HAMPSHIRE CCG | 61 | 65 | 4 |
Table 3. The 10 CCGs with the largest decreases in average waiting time from 2017/18 to 2019/20.
| Clinical Commissioning Group (CCG) | Avg. waiting time 2019/20 | Avg. waiting time 2020/21 | Avg. waiting time change |
|---|---|---|---|
| NHS ST HELENS CCG | 63 | 28 | -35 |
| NHS WEST LEICESTERSHIRE CCG | 44 | 10 | -34 |
| NHS BRADFORD DISTRICT AND CRAVEN CCG | 58 | 25 | -33 |
| NHS BERKSHIRE WEST CCG | 60 | 27 | -33 |
| NHS EAST LEICESTERSHIRE AND RUTLAND CCG | 38 | 9 | -29 |
| NHS WEST ESSEX CCG | 38 | 10 | -28 |
| NHS BRENT CCG | 70 | 43 | -27 |
| NHS SOUTHEND CCG | 36 | 10 | -26 |
| NHS LEICESTER CITY CCG | 38 | 13 | -25 |
| NHS WEST SUSSEX CCG | 62 | 38 | -24 |